Development support functions
HULFT Square Designer provides a variety of support functions to facilitate the development of services.
This section describes the main functions of them.
Memo
You can place memos on the script canvas.
By using memos to add information such as processing outlines and notes, the script is easier to read, maintain, and hand over to other developers.
This section describes how to add memos to the script canvas.
-
From the Basic category on the Designer tool palette, select Memo in Others.
-
Drag the icon onto the script canvas.
-
Decide on the size and position of the memo, and enter any information, such as the description of the script and its components.
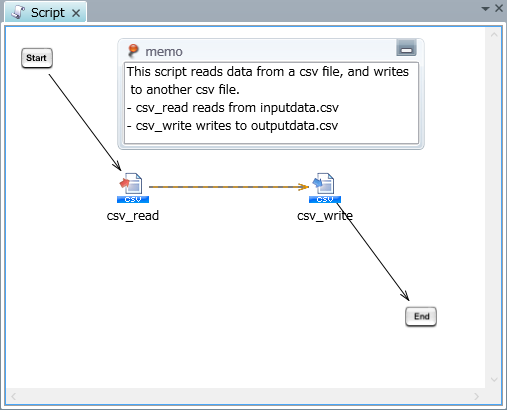
You can display the memo as an icon  by double-clicking its display frame.
You can connect memos to another component by dragging the memos onto a component. By connecting memos to another component, you can easily show which memos refer to which component.

Keyboard shortcuts
The list of keyboard shortcuts available in Designer is shown below.
- Copy
-
Ctrl+C
- Paste
-
Ctrl+V
- Delete
-
Delete
- Select all
-
Ctrl+A
- Switch windows
-
Ctrl+Tab or Shift+Ctrl+Tab
When you have selected inside of the view or editor of Designer, the view of Designer switches.
- Create a new script variable
-
Ctrl+Shift+N
- Open a project
-
Ctrl+O
- Save a project
-
Ctrl+S
- View properties (selected items)
-
Alt+Enter
- Maximize the current view
-
Ctrl+M
- Switch editors
-
Ctrl+F6
- Debug
-
F5
- Run
-
Ctrl+F5
- Set or release a breakpoint
-
Ctrl+B
- Open Help
-
F1
- Build
-
F7
Log levels
Log levels define criteria for the information that is output to logs. You can set the log levels in Option under the Tools menu.
Log level types
The log levels and output contents that can be set are as follows.
Specify the output level of the logs that are output when running a script from Designer.
Output contents differ by log level. Outputting detailed logs at the time of development is useful to view the contents that are successfully processed or to solve a problem when an error occurs.
The following log level types are available:
- NOTICE
-
This type outputs only the information important for the script during the operation phase. The information is output when a startup completes successfully or a fatal error occurs.
The output log levels are as follows:
-
FATAL
-
ERROR
-
NOTICE
-
- INFO
-
This type is the recommended log level for the script during the operation phase.
The result of an operation is output. Generally, one message is output per operation. When you run a script, only the operation results of each component are output.
The output log levels are as follows:
-
FATAL
-
ERROR
-
NOTICE
-
WARN
-
INFO
-
- FINFO
-
This type is the recommended log level during development.
Operation results that are more detailed than INFO are output. Detailed operation results within each component are output when you run scripts.
The output log levels are as follows:
-
FATAL
-
ERROR
-
NOTICE
-
WARN
-
INFO
-
FWARN
-
FINFO
-
- FINEST
-
Messages such as the detailed status of an operation are output. Specify when you want to acquire more detailed information than FINFO.
The output log levels are as follows:
-
FATAL
-
ERROR
-
NOTICE
-
WARN
-
INFO
-
FWARN
-
FINFO
-
FINEST
-
- DEBUG
-
Messages for debugging, such as the internal status, are output.
The output log levels are as follows:
-
FATAL
-
ERROR
-
NOTICE
-
WARN
-
INFO
-
FWARN
-
FINFO
-
FINEST
-
DEBUG
-
The highest log level is NOTICE and the lowest is DEBUG. The lower the log level is, the more detailed the output log is.
High log level NOTICE > INFO > FINFO > FINEST > DEBUG Low log level
How to set log levels
This section describes how to specify the log level for outputting a log when a script is run from Designer.
-
From the Tools menu, select Option.
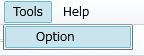
The Option settings window opens.
-
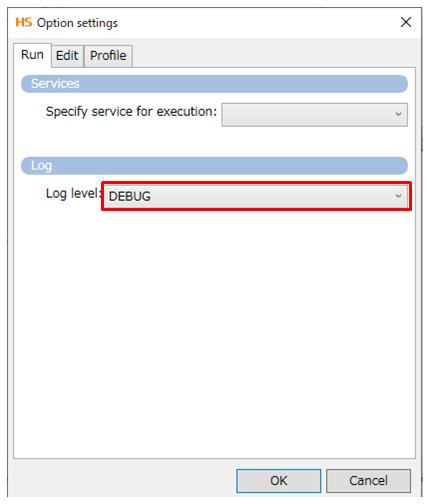
In the section Log in Run, change Log level.
In this example, select the DEBUG option for obtaining the most detailed information.
-
Click OK.
Debugging
By debugging, you can view the processing time for each component and the script execution log.
The behavior when debugging differs from that of a regular test execution in the following respects:
-
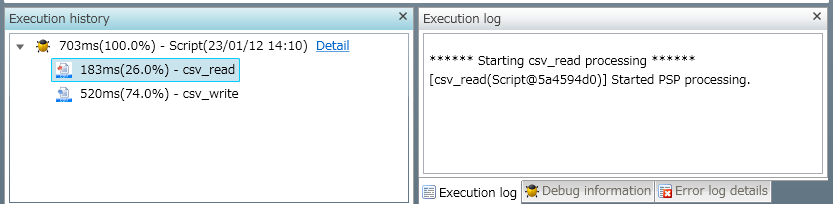
The Execution history view shows the processing time of each component.
-
The Execution log tab in the Execution log view shows a log of the script execution according to the log level that you set.
-
The Debug information tab in the Execution log view shows the value of the script variable held at that point in time.
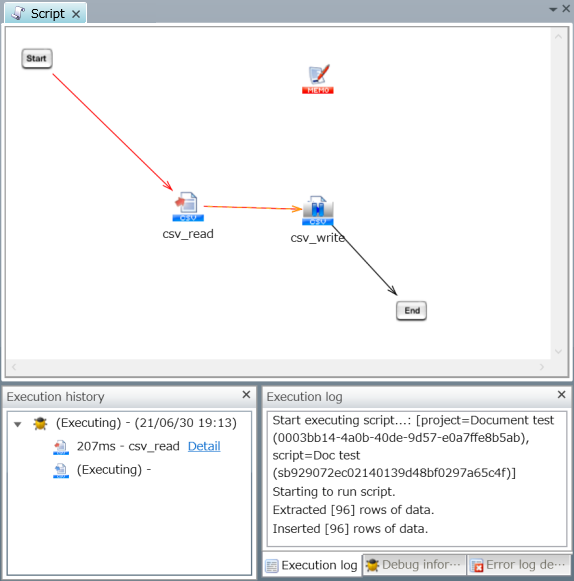
For execution in debug mode, in addition to the overall processing time, the processing time for each icon is also shown.
You can view logs on errors that occur while a script is running or logs with processing content from  > SERVICE EVENTS > HULFT Integrate.
When scripts like those described below are executed and the number of log records exceeds 10,000, to view all log records, use the event log for HULFT Integrate.
-
The log level is set as DEBUG, and a large amount of data is handled during debugging
-
A large volume of processing is required because of loop execution or other reasons
-
To verify logic, use a small amount of data for the test. When you execute a script using a large amount of data, set the log level to INFO.
-
Script operation pauses at locations where a breakpoint is set, and you can view the values of script variables held at these points in time.
For details about breakpoints, refer to Breakpoint.
This section describes how to run debugging.
-
Click Start/Restart script debug execution on the tool bar.
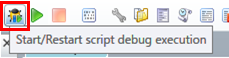
Debugging starts.
For details about the contents displayed in the execution history and execution log, refer to Execution history.
= Hint =The script pauses at any component on which a breakpoint has been set.
When an operation is paused at a breakpoint, the part of the process flow that has been completed is indicated in red.
The process resumes when you click Start/Restart script debug execution on the tool bar again.
Execution history
The Execution history view shows the execution history for scripts that are executed in debug mode.
Showing execution history
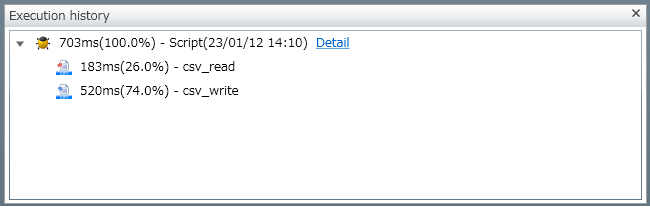
The processing times of the entire script and of each icon are shown.
-
The ratio for the execution time of the script is always displayed as 100.0%.
-
The sum total may not reach 100 even when the ratio for the execution times of the icons within the script are totaled. This is because the ratio of each execution time is rounded down to one decimal place.
The following is an example image of the Execution history view:
-
When execution is successful
-
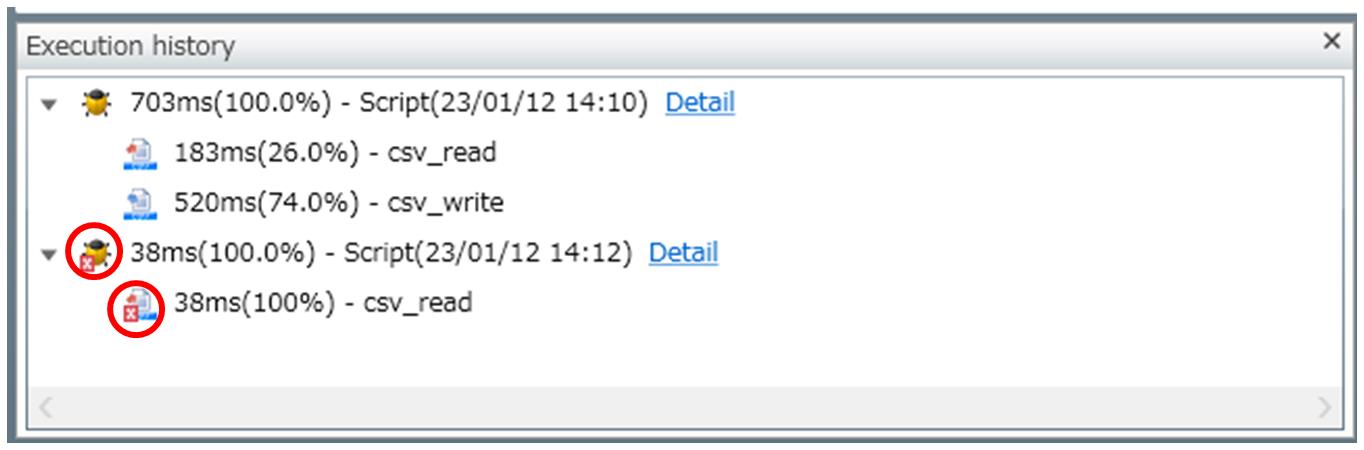
When an error has occurred
When an error occurs while a script is running, an X mark is shown on the icon whose processing failed.
Filtering execution log
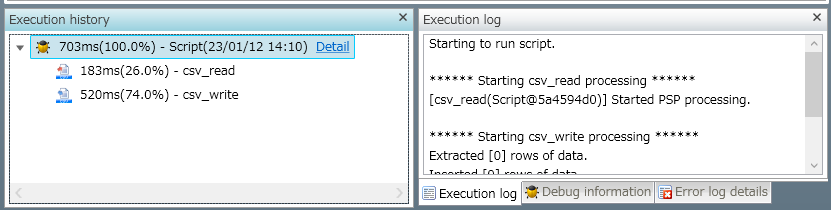
Select an icon in the execution history to show the log that was output during the execution of that icon.
-
When a script is selected
-
When an icon is selected
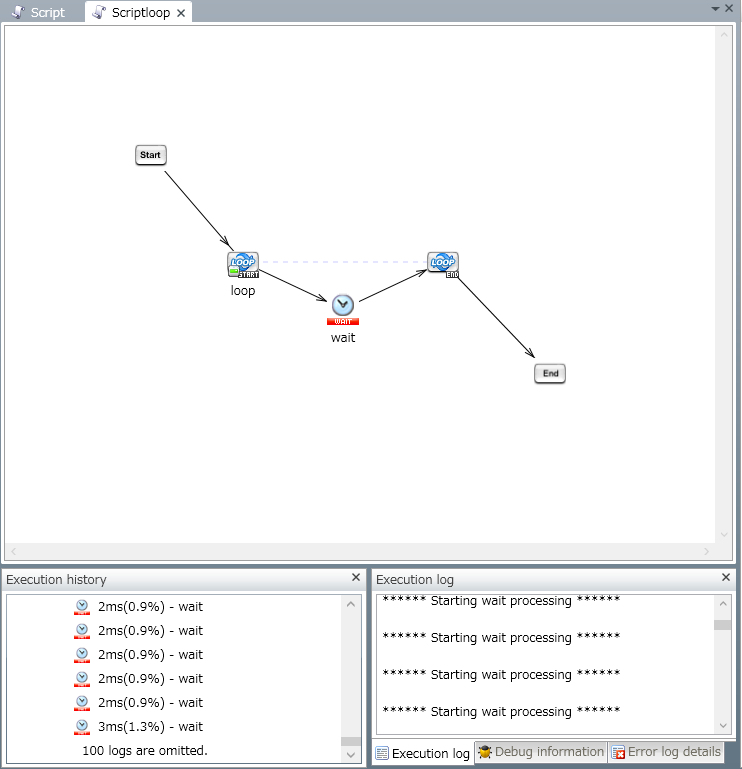
Omission of icons
When the number of icons in the execution history becomes very large because of a loop or other operations, part of the icons are omitted from view. A maximum of 100 child nodes is displayed for one icon.
-
When a script is selected
Breakpoint
A breakpoint is a point at which the process of the script pauses when debugging a script created in Designer. By setting these points, you can, for example, view the value of a script variable in the middle of running the script.
The use of debugging and breakpoints enables you to efficiently proceed with job development.
This section describes how to set breakpoints.
-
On the script canvas, right-click a component icon on which you want to set a breakpoint.
The right-click menu opens.
-
Select Set/Release breakpoint. The breakpoint is set, and a breakpoint symbol
 is placed on the component icon.
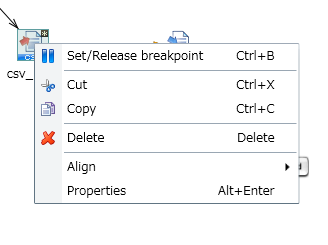
For example, when you set a breakpoint on the component icon csv_write  , the icon looks like this:
  .
.
To release a breakpoint, open the right-click menu of the component icon and select Set/Release breakpoint.
Grid and icon alignment
Aligning icons by applying a grid to a script or using the icon alignment function helps improve the readability of the script, prevent bugs, and make maintenance more efficient.
You can use grids and icon alignment on the script canvas and in the Mapper editor.
For details, refer to HULFT Square Designer.
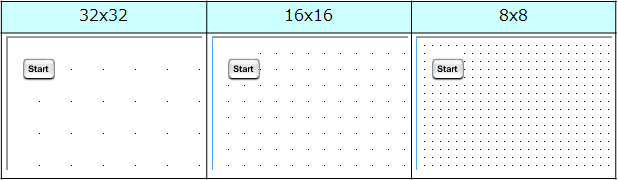
Grid
The following grid sizes are available. Scripts are easier to read when the same grid format is consistently used in the job.
-
32x32
-
16x16
-
8x8
Icon alignment
The icon alignment function becomes available when you select multiple component icons.
The available options when you select two icons or more are Align left, Align right, Align top, and Align bottom. When you select three icons or more, you can also use Align horizontally and Align vertically.
Variables
When you design a script, you can use the characteristics of variables to build a flexible job that adjusts to structural changes.
Script variables
Script variables can be set when editing scripts in HULFT Square Designer.
Script variables are mainly used as temporary data within a script or for the transfer of data between scripts.
Users can freely define script variables, and multiple data types are available for use.
Variable Mapper and Document Mapper are used to store values within a script. When you input script variables in the input fields, you can combine them with character strings.
You can use script variables for general purposes, but because script variables are defined for each script, using environment variables is recommended in places where variables may be used system-wide or structural changes may occur during operation.
Environment variables
Environment variables can be set from  > HULFT INTEGRATE > Variables.
Users can freely define environment variables. The names must be unique system-wide because variable resources can be commonly used system-wide. It's recommended that you use them for character strings that may change during job operation (such as file paths and resources).
Environment variables can be combined with character strings. Therefore, if only a file directory would change, you could use an expression such as %{FILE_DIR}/read_file.csv. When the variable is defined in this way, you only need to change the environment variable setting instead of correcting the entire job, and you can flexibly handle structural changes during operation.
Component variables
Component variables are defined separately for the operations of different connectors. Component variables store the number of threads processed and processing results such as error content.
Users can't store values in component variables.
Variable Mapper or Document Mapper are used to obtain values within a script.
Access log recordings
Access Log is a function that outputs operations accessed in HULFT Square to a log.
A log is output to Monitoring that gives you information about what action was taken, by which user, at what time, with which tool, and in what way.
For details about the logs that can be checked with event monitoring, refer to Monitoring.
You can use the access log for purposes such as the following:
-
Managing users' access history
-
Recording audit trails for unauthorized use
-
Investigating the causes of system failures
In these ways, you can record information that can be useful regardless of whether you are in the development or operation phase.
Project auto-saving function
If you don't perform any operations in Designer for a certain period of time while editing a project in Designer, the project is automatically saved in the backup area.
The default period for auto-saving is 15 minutes after you perform an operation in Designer. You can set anywhere between 10 to 25 minutes.
Set from the Tools menu in Designer. For details, refer to Project auto-saving in the Tools menu.
If a project is automatically saved, a confirmation window such as the following is displayed when you open the project the next time, to confirm whether to open the auto-saved project or not.
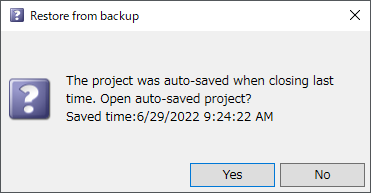
When you select Yes, the project auto-saved in the backup area opens. If you select No, the project saved on the service opens.
Also, automatically saved projects are deleted when the following operations are performed. (This applies to projects that were saved automatically.)
-
Saving the project
-
Deleting the project
-
Renaming the project
-
Exiting Designer with the project open
-
Sharing the project
-
Disabling the sharing of the project