Data processing information
Configure the data processing information settings.
In the DataMagic Management screen, click the Data processing to display the Data Processing Information List screen, and then click the New button to display the Data Processing Settings screen. Configure the settings as shown below and save them.
1. Enter cnv12 in the ID field.
2. Configure the settings for the input file (C:\Examples\12\input\sampleIN12.csv) and the extraction condition.
Select an input file format in the Object palette, and then drag and drop it on the input area. Double-click the icon to display the Input Settings screen.
Configure the settings as shown below.
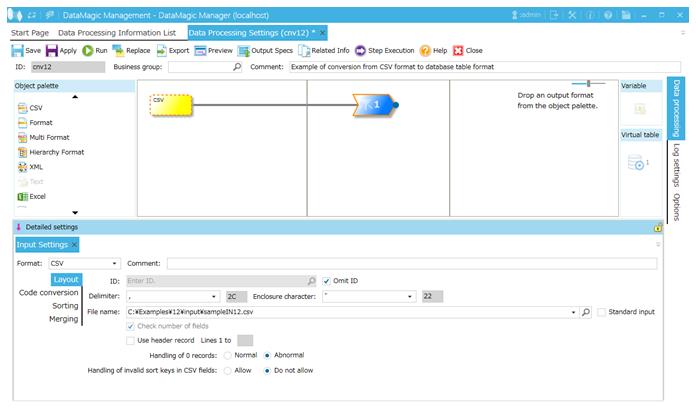
Screen 8.113 Input Settings screen
3. Configure the settings for the output file (ID=OUTDB12).
Select an output file format in the Object palette, and then drag and drop it on the output area. Double-click the icon to display the Output Settings screen.
Configure the settings as shown below.
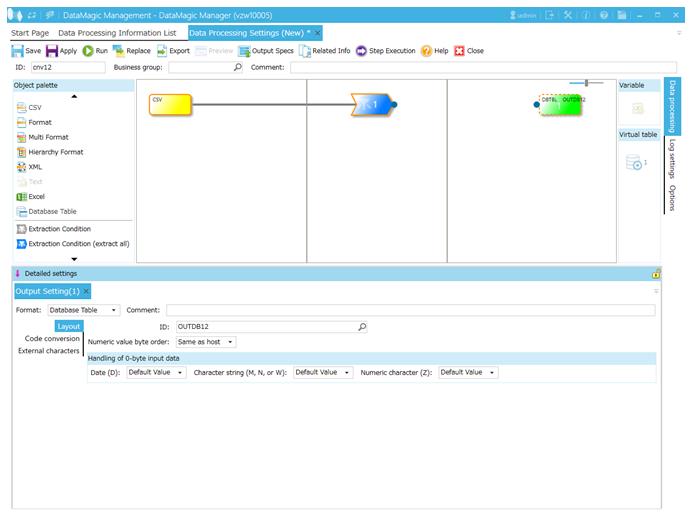
Screen 8.114 Output Settings screen
4. Configure the settings as shown below.
Choose the Extraction Condition icon and drag and drop it onto the Output file icon on the right to draw a relation line.
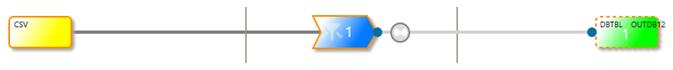
Screen 8.115 Mapping of extraction conditions and output file
5. Specify the output format.
1) Display the Set Mapping Information screen.
Double-click the Mapping icon created on the relation line between the Extraction Condition icon and Output icon. This displays the Set Mapping Information screen.
2) Create fields in the input-side tree.
Click the Add multiple button at the top of the input-side tree (left) to display the Additional Field Settings dialog box. Enter 5 for the number of additional fields in the dialog box and click the OK button. Five new fields are added to the tree.
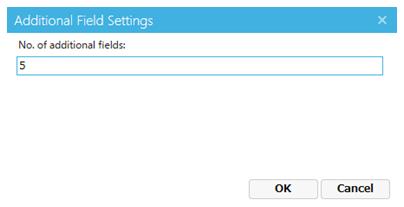
Screen 8.116 Additional Field Settings screen
3) Check the output-side tree view.
The output-side (right) tree is displayed as follows.
If the actual display varies from the following, check the ID settings and input file settings.
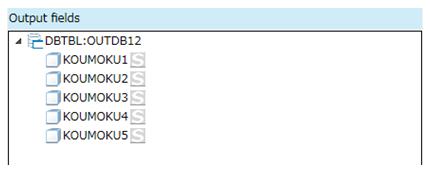
Screen 8.117 Output-side tree
4) Draw relation lines.
You can draw a relation line by dragging and dropping the field node in the left tree to the field node in the right tree. Draw relation lines as shown in the screen below.
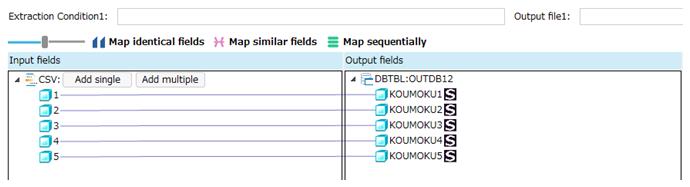
Screen 8.118 Input-Output relation lines
5) Register the mapping information.
Click the OK button to register the mapping information.
6. Click the Apply button to save the data processing information.