Data processing with DataMagic
When you design data processing by using DataMagic, place the icons on the pallet, and set the information by displaying the setting screen from each icon. DataMagic allows the visualization of data processing by placing icons on the input area, condition area, and output area and by connecting the settings.
= Remarks =
DataMagic also provides a tutorial for setting data processing interactively. Following this tutorial, you can learn the basic operation of DataMagic.
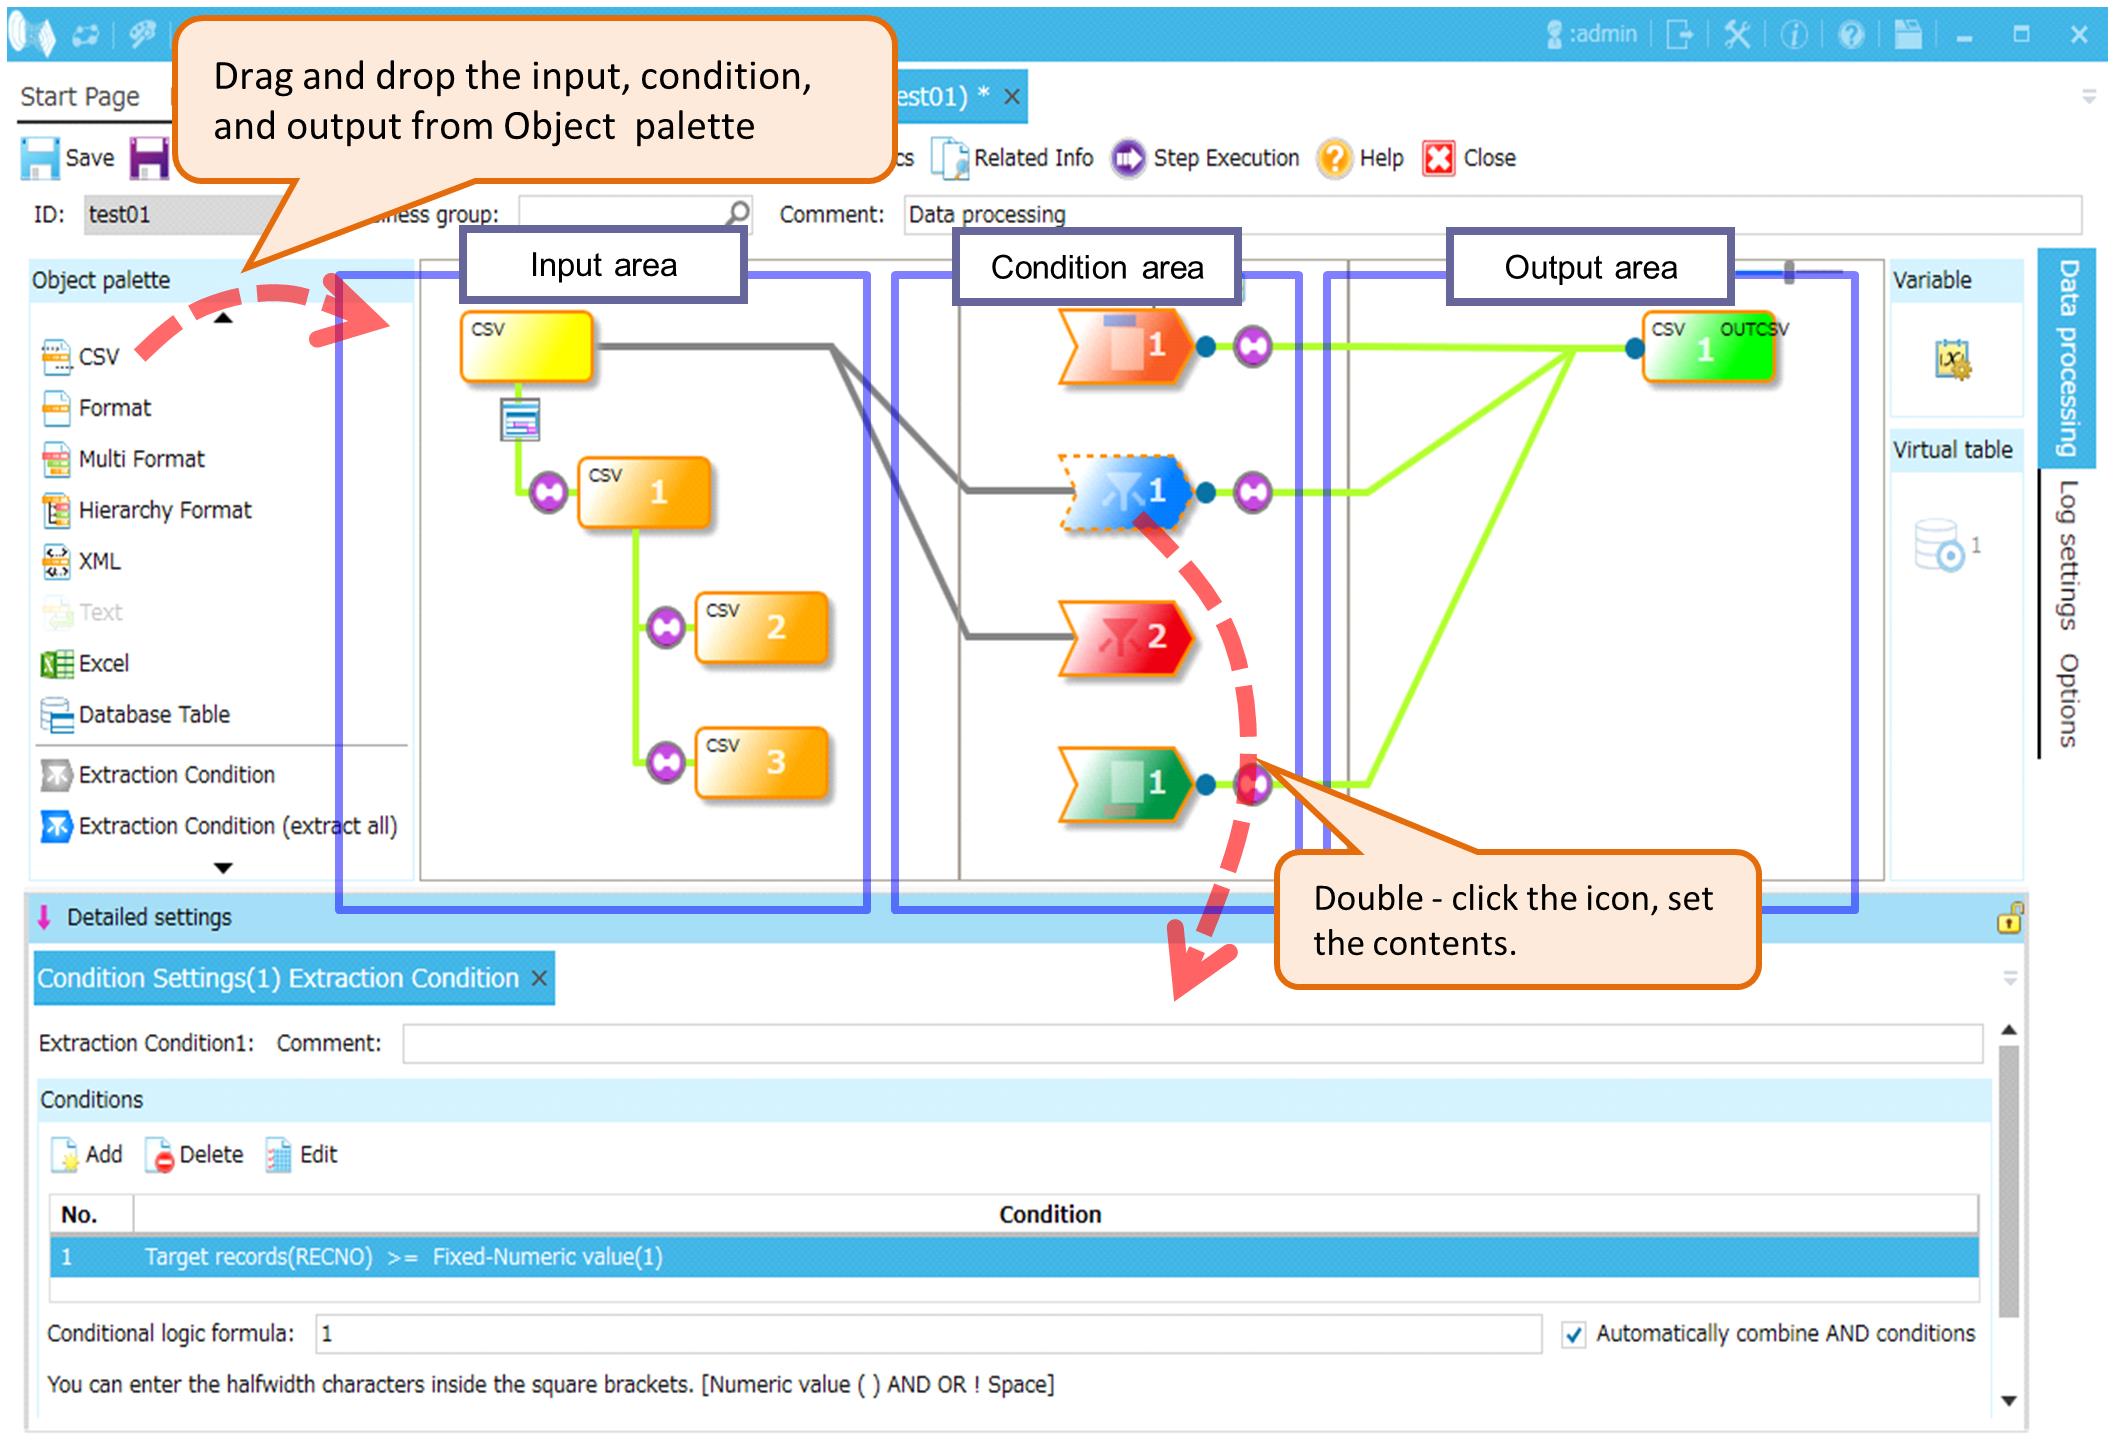
Screen 1.1 DataMagic data processing information settings